Custom Financial Chart Print for 2 months only
Weekly NASDAQ Chart Art Piece
$39.99$4.00
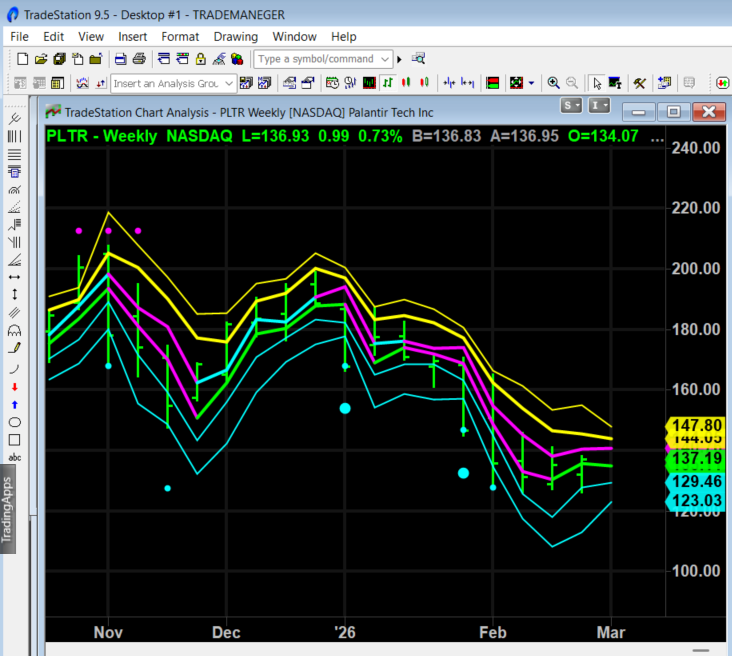
Bring a touch of financial sophistication to your space with this custom print featuring a detailed TradeStation weekly chart analysis. Perfect for investors, traders, or anyone passionate about the stock market, this vibrant wall art highlights real market data and technical indicators from the NASDAQ. Durable print on high-quality paper or canvas, ideal for office or home decor.