Plan Ahead for financial freedom using powerful High-Low Prediction Trendlines and Hi-Lo Pro Indicators!
Prediction Tools (Prediction and Blash)
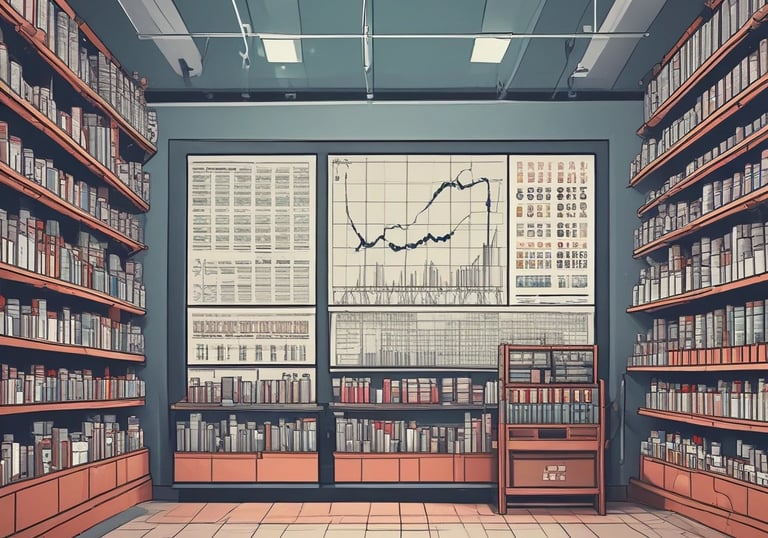
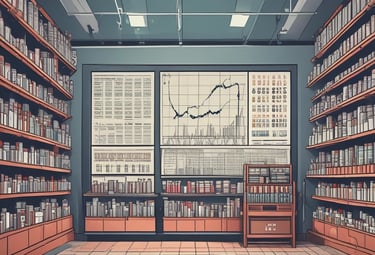
Automatically Pre-generated Precision stock trendline charts designed to visualize stock High, Low and trend
Note the demonstrated trendlines are for information only and may be improved recently. It is for educational purpose and is not financial investment advice.
Our Services
Don't miss out on the opportunity to learn how to maximize profit and minimize risk using our cutting-edge prediction tools for a more effective approach to your stock market investments.
Unlock the potential of your investments with our detailed high and low stock trendline charts. These tools are updated regularly to ensure you have the most accurate and reliable data at your fingertips. By analyzing stock market trends effectively, you can make informed decisions that could potentially lead to significant profits.


Unlock the potential of your investments with our cutting-edge stock high-low prediction charts and tools. Whether you're seeking expertly interpreted charts or DIY options to analyze at your own pace, we have precisely what you need to spot lucrative opportunities ahead. Transform your trading strategy today!
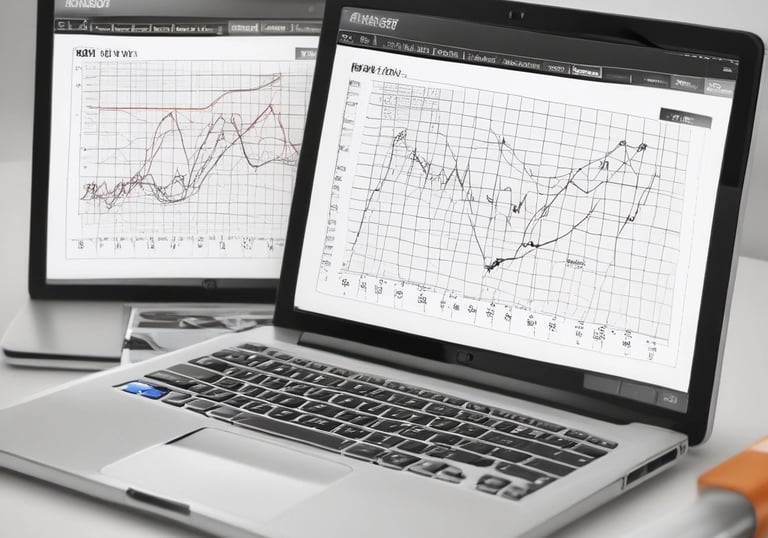
Easy-to-read charts available for multiple stocks and time frames. If the prediction tools installed in TradeStation trading platform is selected then the uping prediction tool will automatically generate predicted potential high and low, or effective resistance and support for any stock and any time frame you choose. We can help you to set up and apply tips of interpretations of predicted target high and low so you will have more chances to trade with higher success rates.
Navigate stock trends with confidence using our effective high-low prediction trendlines
Powerful Prediction Model
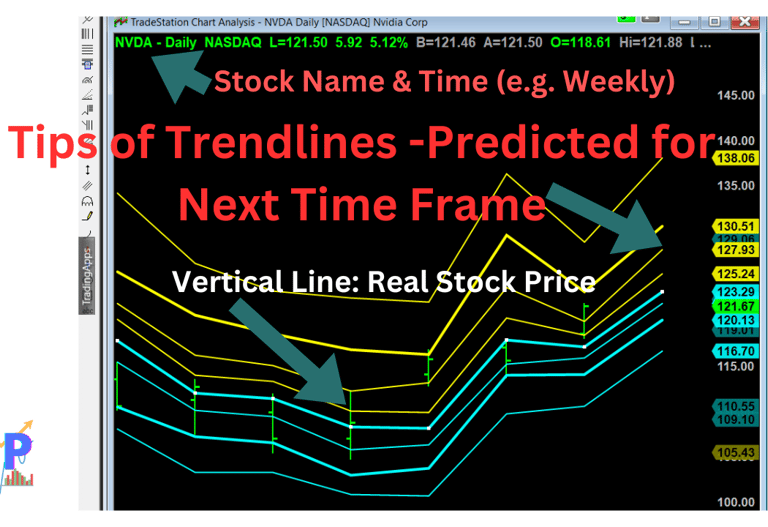
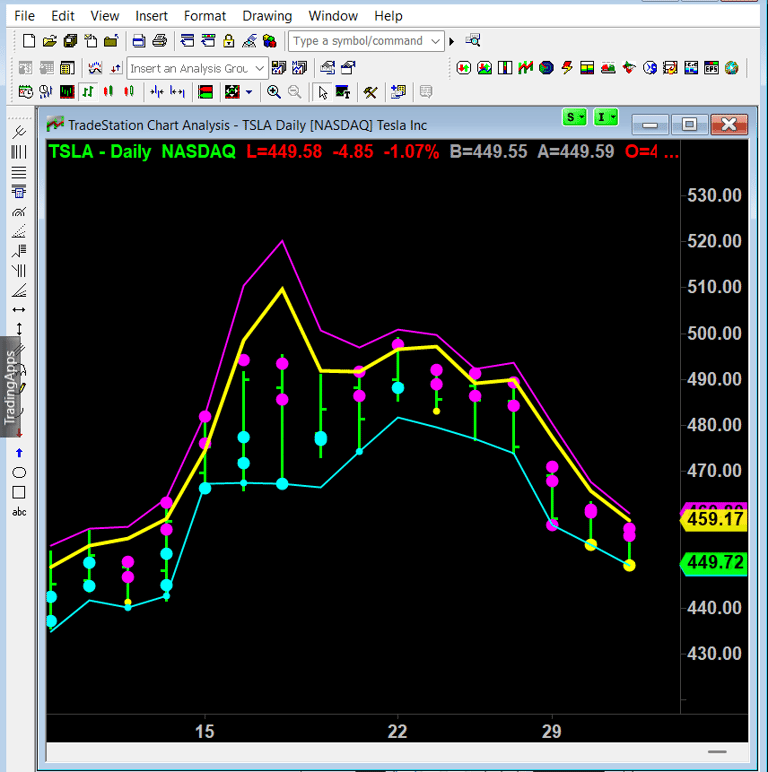
The users can select any stock and any time frame (e.g. 15, 30, 60 minutes, daily, weekly or monthly) and the prediction model automatically pre-generate effective Hi-Lo indicators for the current time frame. It also pre-generate the finalized Hi-Lo indicators for the next time frame if the current time frame is complete.
As shown in top right chart, the vertical line is real time stock price shown in OHLC bar chart similar to candlestick chart including open, high, low and close prices. The uping prediction model pre-generate insightful stock high and low trendlines (Hi-Lo indicators) that encompass stock moving range at the current time frame, and also for the next time frame if the current time frame is complete. For example, the tips of the prediction trendlines on daily chart define potential high and low tomorrow (e.g. December 28) after the stock market is closed on December 27. The trendlines at the current time frame define the adjacent high and low, and it moves to the next level trendline if breakout or breakoff happens for the current time frame (e.g. for 15 minutes, 60 minutes and daily, etc.).
These pre-generated Hi-Lo indicators for the current time frame will not change once they are generated so the stock price basically moves within these trendlines unless they have a breakout or breakoff from a certain trendline.
The prediction model uses historical data and advanced machine learning algorithm to pre-calculate the effective resistance and support at different levels for the current time frame and for the next time frame. These effective resistance and support (will not change once pre-generated) commonly become the actual stock high and low as demonstrated in historical results and in many Youtube examples compared with real time stock prices.


Plan Ahead for financial freedom using powerful High-Low Prediction and Blash Trendlines and Hi-Lo Pro Indicators.
Basically Pre-Define and Visualize Almost All Stock Fluctuation Ranges at Any Time Frame!


Powerful Blash Model
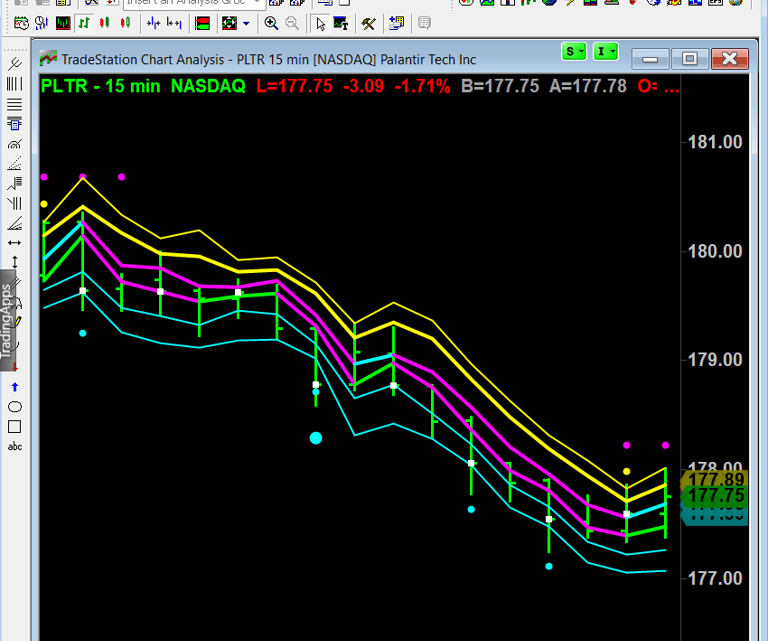
The users can select any stock and any time frame (e.g. 15, 30, 60 minutes, daily, weekly or monthly) and the blash model automatically pre-generate effective Hi-Lo indicators for the current time frame.
As shown in top right chart, the vertical line is real time stock price shown in OHLC bar chart similar to candlestick chart including open, high, low and close prices. The uping Blash model pre-generate insightful stock high and low trendlines (Hi-Lo indicators) that encompass stock moving range at the current time frame. For example, the trendlines at the current time frame define the adjacent high and low, and it moves to the next level trendline if breakout or breakoff happens for the current time frame (e.g. for 15 minutes, 60 minutes and daily, etc.).
These pre-generated blash Hi-Lo indicators for the current time frame may be slightly adjusted based on the current momentum when the stock price approaches closely to a certain trendline with strong momentum. With this type of momentum based adjustment using advanced machine learning algorithm, the trendline typically represents the actual stock high and low well. As shown in blash model charts, the stock price fluctuates among minimal trendlines or indicator dots.
The blash model uses historical data, early stage data from the current time frame, and also advanced machine learning algorithm to pre-calculate the effective resistance and support and also adjust the Hi-Lo indicators based on the current strong market uptrend or downtrend momentum when approaching a certain trendline. These effective resistance and support commonly become the actual stock high and low as demonstrated in historical results and in many examples compared with real time stock prices.
Basically Pre-Define and Visualize Almost All Stock Fluctuation Ranges at Any Time Frame!
Plan Ahead for financial freedom using powerful High-Low Prediction and Blash Trendlines and Hi-Lo Pro Indicators.


Find Charts From Digital Shop


Sample Charts
Plan Ahead for financial freedom using powerful High-Low Prediction and Blash Trendlines and Hi-Lo Pro Indicators.


Brand
Explore our sleek website template for seamless navigation.
Contact
Newsletter
© 2024. All rights reserved.
support@upingstock.com